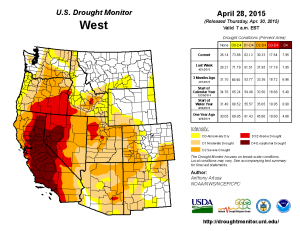
 The latest Drought Monitor maps are out–and the west is painted in color.
Anywhere with color has, at the least, been unusually dry in the short term.
At worst, the color indicates historic drought conditions. You can see the key that explains the image if you click on it.
Parts of the Willamette Valley and areas to the Oregon coast are listed as ‘abnormally dry’ but not in a drought, just unusually dry in the last month.
April Rainfall in Portland was just 1.75″ or 66% of average. However, for the rainy season as a whole — we call it the ‘Water Year’ — Portland has had 28.48″ of rain since October 1, 2014. What’s average? 29.07″ is all.
I just ran the numbers on that and it puts Portland at about 98% of average for the Water Year so far. That is excellent.
Unfortunately, as we know, there’s very little mountain snowpack around the west this year and that’s going to impact streams, rivers, reservoir levels and agricultural water supplies.Â
And to top it off, May starts unusually dry for the first week, at least. I’ve been loving this dry weather…but it may come with a cost this summer.
My rainfall total for April here in Vancouver BC was 2.09 inches- just over 50% of the normal for the month. It’ll be intresting to see how the Pacific Northwest in general does for the next few months.