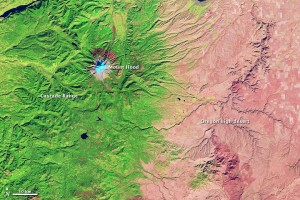
 The green in this NASA Image indicates very wet areas of Oregon. In this case, the Oregon Cascades.
The red indicates very dry areas of Oregon. In this case, just east of the Cascades.
As you can see, the wet and dry areas are right next to each other. That’s because of what we call the rain shadow effect.
Here’s a good article on how that works.
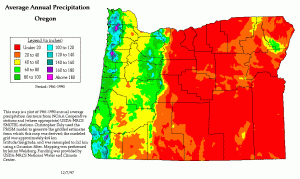
And here’s a great map from the Oregon Climate Service that gives more details on average annual rain totals across Oregon!
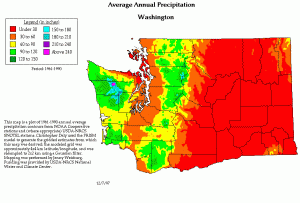
And here’s Washington’s annual rainfall total map. You can clearly see the rain shadow in action here, too.


Leave a Reply