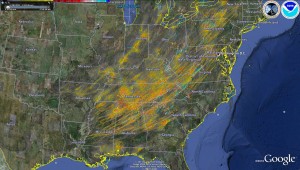
That’s what I had to say after seeing this new map of tornado tracks across Alabama and the rest of the southeast during the nation’s second deadliest tornado outbreak.
The oranges, yellows and reds are the areas of strongest rotation detected by the tornadoes.
The severe weather experts at the National Severe Storms Laboratory  (part of NOAA) put this map together based on what local Doppler radars detected during the outbreak.
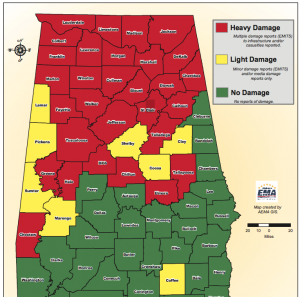
And here’s another map that shows the devastation — in Alabama alone. It was put together by the Alabama Emergency Management folks.
New NOAA Estimates On The Number Of Tornadoes
8am 4/27/11 — to 8am 4/28/11 = 226 probable tornadoes
Or, if you make the window of time bigger:
8am 4/2611 to 8am 4/28/11=312 probably tornadoes


[…] This really cool map from the Portland Oregon Weather Blog […]